


The Accelerator at Princeton
Production Data Infrastructure for Research on the Information Environment
Eighteen months. Fourteen specialists. Multi-source ingestion, medallion data architecture, IRB-grade tiered access, built so research timelines collapse from years to months.
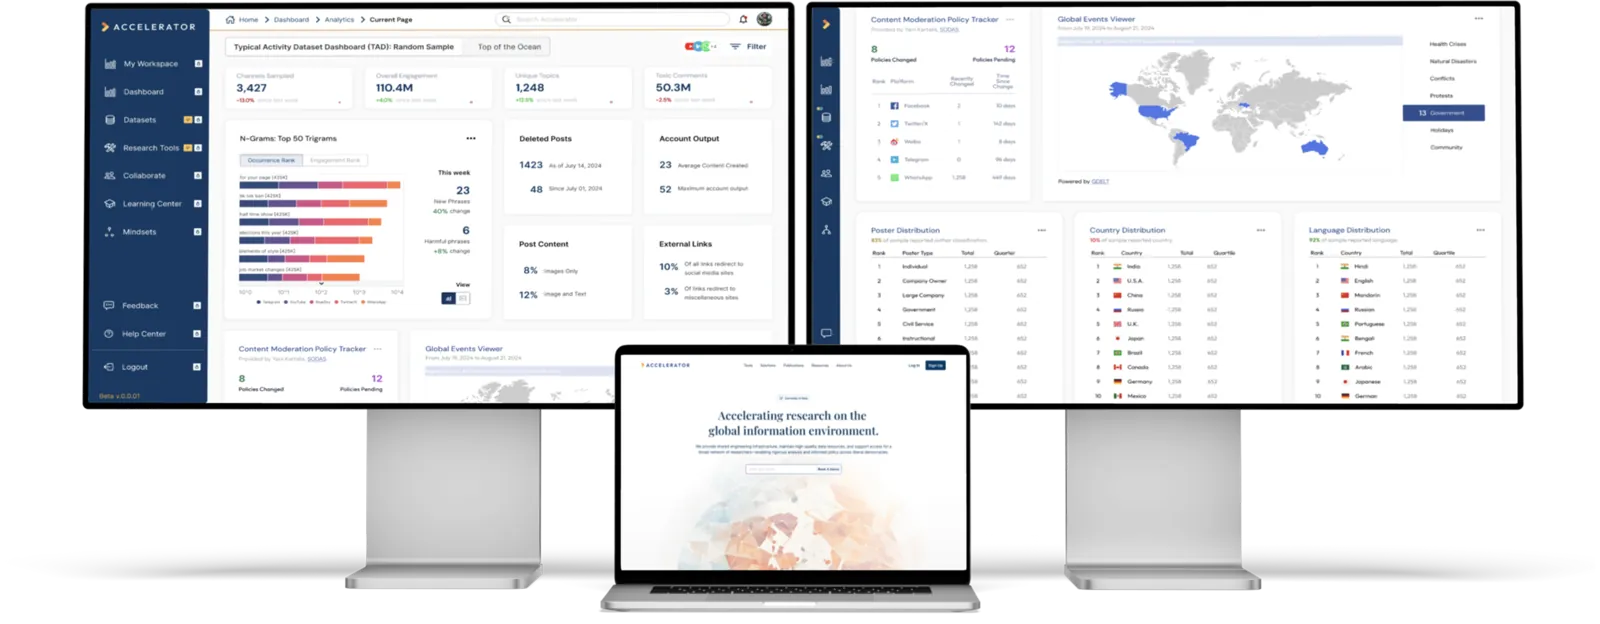
Anonymised mockup of the Princeton Research Accelerator platform · UI design by Amelia Prasad
At a glance
- Client
- The Accelerator, Princeton University research programme
- Domain
- Computational social science · information-environment research
- Engagement
- 12 months, concept to live beta
- Scope
- Multi-source ingestion · medallion data tier · analytics & visualisation · tiered-access platform
- Team
- 14-person multi-disciplinary delivery team
- Stack
- Azure · Databricks · PySpark · Apache ECharts · React · Next.js
- Outcome
- Research timeline cut from 1, 2 years to ~3 months · 100+ active beta users · platform continues as open-source Social Explorer
Why this engagement matters
Every research lab still builds its own crawlers. Every project relitigates IRB. Studies don’t replicate. Findings reach policymakers slowly, if at all.
The information environment, social media, news, online discourse, broadcast, shapes mental health, political violence, election outcomes, and the policy decisions that follow. Yet research on that environment hasn’t kept pace with its scale or its speed.
Princeton’s Research Accelerator was formed to break that pattern: shared production-grade infrastructure, crawlers, data pipelines, analytics surfaces, supporting a broad community of researchers, journalists, and civil-society organisations.
Our job was to build it. Eighteen months, fourteen specialists, Azure as the platform, IRB-grade data governance as a constraint, and the reproducibility expectations of academic research as the bar.
Worth reading even if you’re an enterprise team building a data platform: the disciplines this engagement demanded, multi-source ingestion at scale, tiered access tied to legal clearance, audit-grade lineage, reproducible analytics, are the same disciplines an enterprise data platform needs.
The challenge
The cascading research problem
Researchers studying the information environment face a chain of compounding challenges that pushes typical research timelines from months into years. Each link costs time and money. The chain has to be completed before any actual research begins: IRB and legal approval; expensive API access; phone-bound authentication on platforms like Telegram; custom scrapers per platform; PII handling; inconsistent schemas; APIs that change before the paper publishes.
Stack the chain on top of itself across thousands of researchers and the result is a reproducibility crisis: studies cannot be repeated, methods cannot be compared, knowledge cannot accumulate. The field doesn’t lack rigour at the bench, it lacks the shared infrastructure that would let rigour compound.
What was structurally broken
Duplicated engineering
Every lab builds its own crawlers, manages its own storage, fights its own API battles. The most expensive engineering happens before research begins, then gets thrown away when the project ends.
Inconsistent schemas
Each researcher invents their own data structure. Studies aren’t comparable. Methods aren’t replicable. The field can’t accumulate knowledge because the data underneath the knowledge keeps changing shape.
Legal & ethics overhead
IRB approval, PII handling, international data-protection law, platform terms of service. Every project pays the full cost from scratch, every time. Most of it could be paid once if the infrastructure were shared.
The deeper problem was reproducibility. The field doesn’t lack rigour at the bench, it lacks the shared infrastructure that lets rigour compound.
What we built
A production data platform with four product surfaces, on a shared cloud foundation. Built so a researcher’s first useful query runs on day one of a project, not month nine.
Four product surfaces, in parallel
One platform. One team. One codebase serving researchers, journalists, and civil-society organisations.
Multi-source ingestion
Production-grade crawlers for Telegram, Twitter, news, radio, and television. Telegram via snowball sampling. Rate-limited and TOS-aware by design.
Medallion data tier
Bronze (raw, source-truth), Silver (cleaned, enriched, with PII), Gold (aggregated, anonymised). Each layer’s access governed by institutional clearance.
Analytics & visualisation
Apache ECharts dashboards. N-grams, sentiment, object identification, event mapping. Reconfigurable on the fly by language, date, location, demographic, without code.
Tiered-access platform
Five access levels, from public/journalist (aggregated) to institutional (PII-cleared). Tiered access is not a feature; it is how legal compliance is enforced.
The medallion architecture is the access-control architecture
The single most consequential design call was that the data tier and the access-control tier are the same tier. Bronze, Silver, and Gold layers don’t just describe data quality, they describe what each user is legally allowed to see. A researcher’s clearance level determines which layer they can read. Privacy compliance becomes a property of the data lake, not a thing the UI has to remember to enforce.
The architecture in plain English
Three data layers and a tiered-access overlay. Each layer’s access is governed by the user’s institutional clearance.
Raw, source-truth data
Untouched data ingested from APIs and crawlers. Bronze is immutable: every Silver and Gold artefact is derivable from it, which is what makes studies reproducible from raw data months or years later. Highly restricted access.
Cleaned and enriched
Language detection, entity tagging, deduplication, schema standardisation. Still contains PII; only available to researchers with documented IRB clearance and an institutional-tier login. Where most analytical work actually happens.
Aggregated and anonymised
Statistical summaries, aggregate counts, anonymised time-series. Available to the public tier, journalists, civil-society organisations, students. Rich enough to answer most directional questions; legally safe enough to share widely.
Five tiers, mapped to layers
Five access levels, public, journalist, civil society, researcher, institutional, mapped onto the three data layers. Tiered access is enforced at the data layer, not the UI. Legal compliance becomes a property of the platform, not a feature the front-end can fail to apply.
How we built it
Eighteen months, fourteen specialists across engineering, data science, design, and product, sequenced into four phases, with continuous user research from month one keeping the build honest.
Discovery and foundation
Months 1, 2Stakeholder mapping across a 3,000+ TAM of researchers, civil-society organisations, and journalists. Competitive analysis against Brand Watch and Meltwater. Customer-segmentation surveys with founding members. Azure foundation, Databricks workspace, schema baselines for the Bronze layer.
Pipelines and infrastructure
Months 3, 6Multi-source crawlers for Telegram, Twitter, news, radio, and television. Snowball sampling for Telegram. Rate-limited and TOS-aware collection. Bronze→Silver transformations with entity tagging, language detection, deduplication. The data engineering that has to land before researchers can find anything useful.
Platform and analytics
Months 7, 10Five-tier access system tied to medallion layers. Configurable Apache ECharts dashboards. Filtering primitives for language, date, location, event. A contribution path for researchers to bring Docker-wrapped analyses into the platform. Design system in Figma, React/Next.js implementation, Databricks export integration.
Alpha, beta, hardening, handover
Months 10, 12Alpha walkthroughs with ~30 participants including 4am sessions for Code for Africa. Beta rollout to ~100 participants across The New York Times, Max Planck, NYU and dozens of regional research teams. Iteration on dashboard customisation and onboarding. IRB documentation, operational runbooks, open-source readiness.
How fourteen specialists stayed coherent
Cross-functional pods, engineering, data, design, product, with explicit interface contracts between them and daily integration. A single sole-designer voice (Amelia Prasad) bridging UX research, UI, and de facto product management. The Director of Engineering anchoring infrastructure trade-offs; the Program Director anchoring researcher needs and international outreach. The cross-functional structure was the point: it kept the platform translatable to the needs of users it had never met yet.
What this taught us
Every 12-month build has stories that don’t show up in architecture diagrams. Two are worth naming honestly.
The Telegram problem (or: pick an easier social network to start)
Telegram is one of the harder platforms to crawl at scale because authentication is bound to phone numbers, real, working, individually-active phone numbers. Getting our crawler online required a stack of pay-as-you-go SIM cards, methodically signed up, individually onboarded, and rotated through the crawler. ASDA pay-as-you-go SIMs became a non-trivial line item.
The lesson, when picking the first platform to crawl, optimise for “clean API exists” before “data is interesting.” The interesting data is still there a quarter later, and the engineering you’ve built for the easy platforms largely transfers. We took the harder route on Telegram because the research community needed Telegram most, but if we’d had the choice over, we’d have started elsewhere and grown into Telegram.
Designing for researchers means meeting them where they are
The platform was being built for a community that was, by reputation, set in its ways, a decade of laptop-and-spreadsheet workflows is real. Two phases of testing, ~30 alpha participants, ~100 beta, across time zones, institutions, and continents (early-morning sessions with Code for Africa, conversations with Max Planck and NYU, dozens of regional research teams) revealed how to do it: don’t sell the platform, sell the workflow they already wanted but couldn’t have. Onboarding became preference-driven. Dashboards became customisable. Users contributed their own Docker-wrapped tools that the platform wrapped in UI.
The lesson, change in entrenched user communities is a design problem, not an evangelism problem. If the platform makes their existing workflow possible at lower cost, adoption follows.
Outcomes
This is exactly what the field needs. We’ve been building the same crawlers over and over, now we can finally focus on actual research questions.
The platform shipped, ran a full alpha and beta cycle, and serves the researcher community it was built for. The shape of the change:
Research timelines collapsed
Studies that previously took 1, 2 years to mount, IRB, scrapers, schemas, access, now take roughly 3 months. Around an 87% reduction in the engineering and operations overhead that sits in front of every research project.
100+ active beta users
Across institutions including The New York Times, Max Planck, NYU, Code for Africa, civil-society organisations, and independent journalists, in multiple jurisdictions.
A reproducibility baseline that didn’t exist before
Standardised schemas and shared data layers mean two researchers studying the same event are now studying the same data. Methods become comparable. Studies become repeatable.
A platform that grows with its community
Five tiers of access let the same platform serve a Princeton professor with full PII clearance and a journalist on a deadline working from public-tier aggregates. A Docker-wrapped contribution path means the platform also grows by what its users bring back to it. Same data, different lenses, lawful by design.
Research-ethics and data-governance posture
The disciplines below are how the platform earns academic trust. They are also the disciplines an enterprise data platform handling regulated content needs to demonstrate. We treat them as the same set.
Lawful collection
- • TOS-aware crawling: rate-limited, identifying, and respecting robot exclusion where applicable.
- • Source-permission-driven data collection where required (Telegram via snowball sampling, not account scraping).
IRB clearance and PII handling
- • Tiered access enforced at the data layer (Bronze / Silver / Gold), not at the UI layer.
- • Institutional-tier access requires verifiable IRB approval and signed agreements.
- • PII present only in Bronze and Silver layers; Gold layer is aggregated and anonymised by construction.
- • Access to PII-bearing layers limited to users with documented institutional clearance.
Data lineage and reproducibility
- • Standardised schemas across all sources.
- • Bronze layer is immutable source truth; Silver and Gold are derivable from it. Studies can therefore be reproduced from the same raw data.
Retention and minimisation
- • Retention policies configurable per data class.
- • Minimisation enforced during Bronze→Silver and Silver→Gold transitions.
Technology choices, with reasoning
Stack choices follow workload, not fashion.
What happened next
Princeton’s grant cycle for the Accelerator wound down. The platform we’d built was solid enough that the work didn’t end with the funding: it lives on as the open-source Social Explorer, a localised research-infrastructure project carrying the same architecture forward for the wider research community.
Software outliving its initial funder is, in this domain, a reasonable definition of success. The platform did its job for Princeton’s beta cohort, and the architecture was strong enough to keep going under different stewardship.
Talk to the engineers who built this
If you’re building a data platform that has to satisfy regulators, reproducibility, or institutional review, and your scale is large enough that ‘every team writing their own crawler’ is no longer viable, the team who delivered Princeton’s Accelerator can walk you through the architecture, the trade-offs, and what we’d do differently with hindsight.
Related work