


PIXLISE
Streaming Mars Rover Data into Real-Time Decisions
We replaced a 30-hour batch processing pipeline with a 10-minute streaming system for NASA’s PIXL instrument on the Perseverance Rover. Runner-up for NASA Software of the Year 2023; now open source.


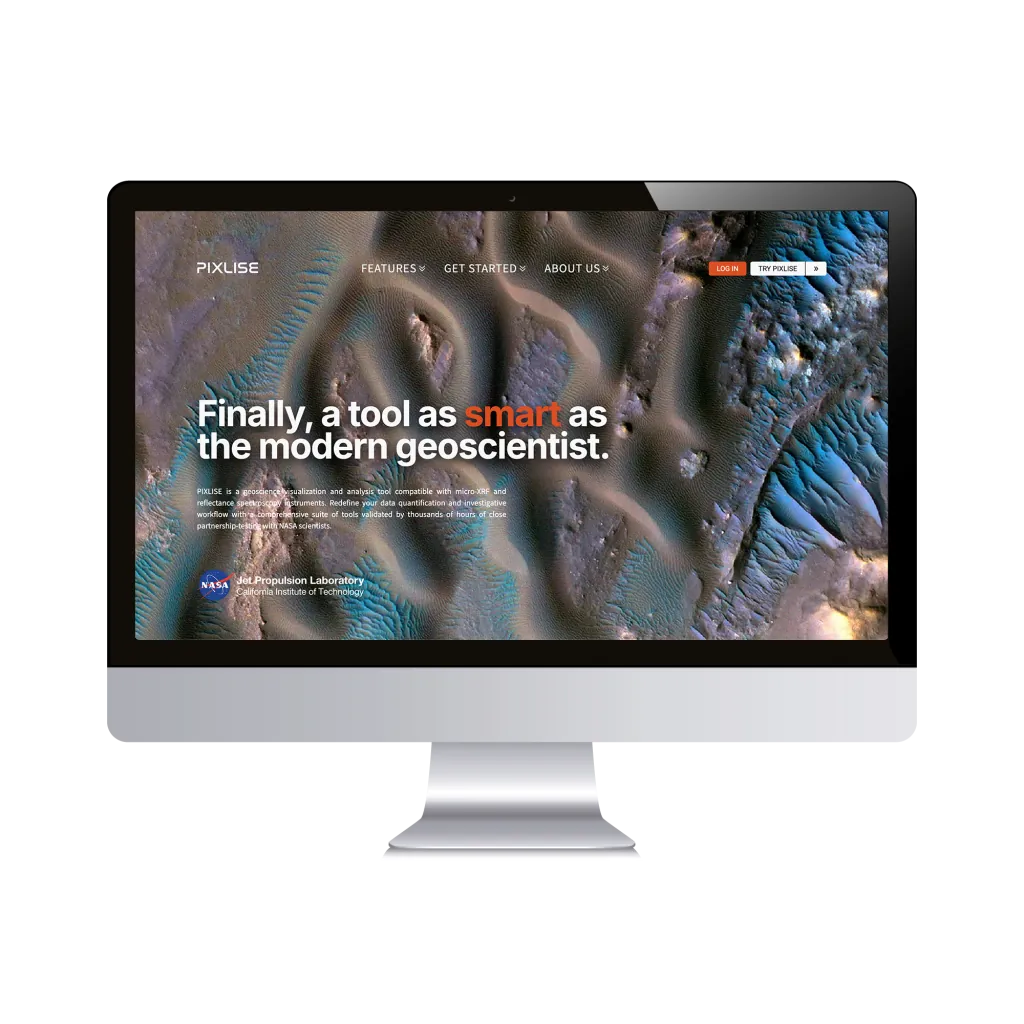
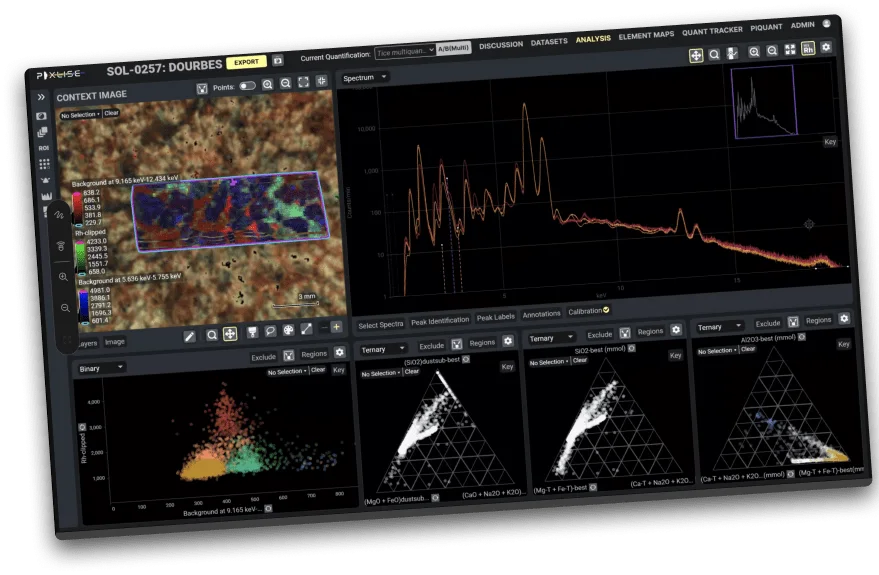
The PIXLISE web analytics surface, scientists explore spectrometer data without leaving the browser.
At a glance
- Client
- NASA / JPL, PIXL instrument, Perseverance Rover
- Domain
- Mission-critical scientific computing · X-ray spectrometry · Mars surface science
- Recognition
- Runner-up · NASA Software of the Year 2023
- Headline result
- 30-hour batch processing → ~10 minutes (180×)
- Cost result
- Platform run cost $3,500/mo → $900/mo (74% TCO reduction)
- Stack
- AWS · Kubernetes · Infrastructure as Code · CI/CD · Python · Web UI
- Outcome
- Streaming-first data platform serving live mission ops · open source as PIXLISE
Why this engagement matters
A Mars rover does not operate on Earth time. Every Sol, the team has hours, not days, to decide what the rover does next.
If the data takes 30 hours to process, you make decisions on yesterday’s information. If it takes 10 minutes, you make decisions on what the rover saw this morning. That gap, between fresh data and stale data, determines how much science the mission produces.
PIXL, the Planetary Instrument for X-ray Lithochemistry on the Perseverance Rover, generates rich elemental and mineralogical data that lets scientists identify rock and sample compositions in real time. The instrument was extraordinary. The processing pipeline that turned its output into actionable maps for scientists was not. We were brought in to close the gap.
Worth reading even if you’re an enterprise team building a mission-critical data platform: the disciplines this engagement demanded, streaming-first ingestion, cloud-native cost engineering, software domain experts can use without involving the platform team, distinguish a good platform from a budget-eating one.
The challenge
A day on Mars time
Imagine a science lead opening a downlink window. The rover’s spectrometer ran an analysis on a rock face the day before, and the data has just landed. The team needs to look at it, decide whether the result is interesting, and instruct the rover what to do next, all before the next uplink window closes. The hardware did its job in minutes. The processing pipeline takes 30 hours.
By the time the maps are ready, the decision window is gone. The rover has moved on. Each Sol that passes is a Sol of mission opportunity that can’t be reclaimed. Multiply across an entire mission and the cost is not theoretical, it is measured in lost science.
What was structurally broken
A 30-hour batch cycle
The previous tooling treated each dataset as a complete batch and processed it in one long pass. No incremental result, no partial map, no early indication that something interesting was on screen. By the time the maps were ready, the decision window was gone.
Excel-and-Dropbox as the analysis surface
Once processing finally completed, outputs were shared as spreadsheets via cloud storage. Versioning was approximate. Comparison across teams meant emailing files. There was no shared, authoritative analytical surface.
Scientists as sysadmins
Running the pipeline meant compiling C, configuring operating systems, and managing distribution. A handful of specialists were the only people who could turn instrument data into something analyseable. Throughput was throttled by their availability.
The deeper problem was that the team had built scientific software that scientists couldn’t run, and that couldn’t keep up with the mission timeline even when the specialists did run it.
What we built
A cloud-native, streaming-first data platform with four product surfaces, recognised as runner-up for NASA Software of the Year 2023, and now open source.
Four product surfaces, in parallel
One platform. One team. Built around the actual operational reality of Mars data.
Streaming ingestion
Receives data as it lands from JPL’s mission systems, regardless of whether the dataset is complete. Designed around the operational reality that downlinks are unpredictable.
Continuous processing
The 10-minute system. Produces analytical outputs incrementally as data flows in. Every fragment of new data updates the in-progress map without restarting the pipeline.
Web analytics surface
PIXLISE itself, a browser-based UI where scientists explore spectrometer data, run comparisons, and annotate findings without compiling C or configuring an OS.
Cloud platform
AWS-based, fully infrastructure-as-code, container-orchestrated through Kubernetes, deployed via CI/CD. Reproducible from scratch. Costed clearly. Audit-able.
Streaming-first, not batch
The single most consequential design call was that the processing pipeline never waits for “all the data.” Mars downlinks don’t arrive in tidy, complete files, data trickles, datasets fragment across windows, the end of a dataset isn’t always reliably signalled. A batch pipeline that wants the full file before it starts will sit idle for most of every Sol; a streaming pipeline that processes whatever has arrived can give scientists a usable answer in minutes. The 180× speedup is the visible outcome; the architectural call is the cause.
The architecture in plain English
Four layers, each designed against the operational reality of Mars data.
Ingestion layer
Accepts partial, ordered, sometimes-out-of-order downlinked data. Tolerates missing end-of-file markers. Buffers and merges fragments as they arrive. Triggers downstream processing on every meaningful update, not on dataset closure.
Processing layer
Kubernetes-orchestrated workers running the spectral-analysis algorithms incrementally. Each new fragment of data updates the in-progress analytical output without restarting the pipeline. Idempotent, recoverable, observable.
Web analytics layer
The PIXLISE UI. Scientists query, filter, compare, and annotate without touching the underlying infrastructure. Designed so a planetary scientist can do science instead of system administration.
Cloud foundation
AWS infrastructure defined in code, deployed by CI/CD, monitored continuously. Cost-engineered to keep the running platform under $1,000/month, a number that matters in a research-budget world.
How we built it
Four phases, against the constraint that the pipeline had to keep up with rover ops the entire time it was being built.
Discovery and platform foundation
Engaging the JPL teams running PIXL operations to understand the actual downlink and decision cycle. Establishing the AWS foundation, IaC baseline, CI/CD scaffolding. Naming the streaming-first thesis as the architectural anchor before writing the pipeline.
Streaming pipeline build
Replacing the 30-hour batch with an incremental, fragment-tolerant pipeline. Kubernetes workers running spectral-analysis algorithms against partial data. Recovery semantics so a failed worker doesn’t restart 30 hours of compute. The engineering core of the project.
Web analytics surface
PIXLISE, the browser-based UI. Scientists query, filter, compare, and annotate. The interaction model designed so people who think about minerals do not also have to think about Linux. Direct integration with the streaming pipeline so analyses update as the underlying data does.
Hardening, recognition, open-sourcing
Production hardening, observability, security review, JPL handover. Submission to NASA Software of the Year, runner-up, 2023. Preparation for open-sourcing so the platform could continue serving the mission and the wider scientific community.
Working alongside JPL
Working alongside JPL meant respecting two operational rhythms at once: a mission timeline that does not pause, and an engineering schedule with its own dependencies. We ran in tight integration windows, with continuous deploys rather than big-bang releases, and observability instrumented from day one, partly because that’s good engineering, partly because anything mission-adjacent has to be debuggable in real time.
What this taught us
Four phases on Mars data teaches things you don’t learn building enterprise SaaS.
Mars downlinks are a fickle beast
You never knew when a downlink would arrive, whether you’d get a complete dataset, or where the end of a file was supposed to be. Building a pipeline against that meant a series of careful, often counter-intuitive experiments, and we ran them on a time crunch, with the mission depending on us shipping. A lot of what looked like data engineering was actually careful empirical detective work.
The lesson, never assume a complete dataset has arrived. If you’re building anything that processes data from a system you don’t control, design the pipeline around the worst case (partial, out-of-order, unsignalled) and treat the happy path as a special case. And if you have any influence on the upstream system, get the engineers there to signal the end of files and datasets explicitly. We carry that into every streaming-data engagement we run today.
Outcomes
Without Tom, we would not have been able to build the game-changing prototypes and operational systems we delivered to NASA, DARPA, and private industry. Absolutely critical as an engineering leader.
The platform shipped, ran in production for the rover mission, was recognised by NASA, and now lives on as open source.
30-hour batch became ~10-minute streaming
A 180× collapse of the time between data arriving and scientists having something to look at. The mission’s decision cadence shifted from “yesterday’s data” to “this morning’s data.”
74% reduction in monthly platform run cost
From ~$3,500/month to ~$900/month, achieved through cloud-native cost engineering, right-sizing, right-scheduling, eliminating idle compute, IaC discipline. The platform pays for itself many times over in mission opportunity.
NASA Software of the Year 2023 runner-up
External recognition from the people who run the world’s hardest scientific software programmes that this work meets the bar.
Scientists doing science, not system administration
The non-cloud predecessor required compiling C and configuring operating systems before any analysis could run. The replacement runs in a browser. Throughput became science-limited, not software-limited, and supported peer-reviewed publications.
Operational posture
What it takes for software to be trusted in mission-critical scientific operations, and what carries directly into enterprise mission-critical platforms.
Reliability and observability
- • End-to-end tracing across ingestion, processing, and analytics surfaces.
- • Recovery semantics that don’t restart 30 hours of compute when a worker fails.
- • Monitoring sized for the operational rhythm, debuggable in real time during mission decision windows.
Cloud-native security
- • AWS posture aligned to the security standards of NASA-adjacent work.
- • Identity and access controls between ingestion, processing, and analytics tiers.
- • Secrets managed through dedicated secrets infrastructure, never in code.
Reproducibility through Infrastructure as Code
- • The entire platform deployable from scratch by IaC, no manual provisioning, no snowflake servers.
- • Environments are repeatable; infrastructure changes are reviewed in code; audits start from a known state.
Cost discipline as a first-class concern
- • Right-sizing, right-scheduling, idle-elimination as ongoing engineering practice.
- • The 74% monthly cost reduction was an engineering outcome, not an accident.
Technology choices, with reasoning
Stack choices follow workload, not fashion.
What happened next
PIXLISE is open source. The platform we delivered for the PIXL mission continues to serve the mission and is contributed to by a wider scientific community.
Software that outlives its initial commercial engagement is a reasonable definition of success. PIXLISE shipped, served the mission, won external recognition from NASA, and continues under community stewardship.
Talk to the engineers who built this
If you’re building a mission-critical data platform, where downtime has real cost, where the data arrives unpredictably, and where the people using the analytics aren’t the people who built the pipeline, the team behind PIXLISE can walk you through the architectural decisions, the trade-offs, and what we’d do differently with hindsight.
Related work